

AutoBenchmark Tutorial#
Introduction#
AutoBenchmark is a subset of the testbench system created with the aim to provide a simpler framework for simpler benchmarks.
Little to no code needed to implement a new benchmark
If all intermediate product exist, skip reading and load from histograms instead

Benchmark has the following structure from start to finish#
Why is it called auto?#
metric path from a subclass auto-generated (no need for developer input)
flags are determined automatically from the columns we need
columns needed from the custom accumulation function are also automatically retrieved via code inspection
Histogram axis have predefined default so you don’t have to define them by default. You can however overwrite any axis to change min, max, log/linear, etc…
metric have an auto generated name because you can load preexisting histograms from the columns defined in it. This also allows to keep track at the figure level what columns where used for it. This can be used later to filter and sort plots in sub categories in the pdf report.
Examples#
In all the following examples, the same code need to be used to actually call the benchmark class and make the benchmark. This code is the following:
from pathlib import Path
from hist import axis

import datapipe_testbench
from datapipe_testbench.auto_benchmark import (
    AutoBenchmark,
)
from datapipe_testbench.inputdataset import InputDataset
from datapipe_testbench.store import MetricsStore, ResultStore

datapipe_testbench.utils.init_log()

class MyBench(AutoBenchmark):

    data_level = "dl2"

    col_lists = [
        ("true_impact_distance",),
    ]


base = Path("/local/home/ccossou/data/cta")
prod5_g = InputDataset.from_dict(
    {
        "dl2": base / "gamma-diffuse.dl2.h5",
        "name": "Prod 5 gammas",
    }
)
prod5_p = InputDataset.from_dict(
    {"dl2": base / "proton.dl2.h5", "name": "Prod 5 protons"}
)

bench = MyBench()

out_path = Path("./testbench/Prod5_gamma")
out_g = MetricsStore(base_path=out_path, name="Prod5_gamma")
out_g.set_inputdata(prod5_g)
bench.generate_metrics(out_g)

out_path = Path("./testbench/Prod5_proton")
out_p = MetricsStore(base_path=out_path, name="Prod5_proton")
out_p.set_inputdata(prod5_p)
bench.generate_metrics(out_p)

out_path = Path("./testbench/reports/Prod5_gamma_vs_proton")
rstore = ResultStore(out_path, name="Prod5 Gamma vs Proton")

comp = bench.compare_to_reference([out_g], rstore)

bench.make_report(rstore)
AutoBenchmark parameters#
To make a benchmark, you need to derive your own class from AutoBenchmark. This is to ensure that each benchmark is unique and always provide the same set of plots. In practice, you only redefine pre-existing parameters of AutoBenchmark, and don’t need to write any new method in this class.
data_level: Data level to be read from the file. Possibles values: [“dl0”, “dl1”, “dl1_images”, “dl2”, “dl3_irf”, “dl3_benchmark”]. This is needed because the InputDataStore structure contains various files for various datalevel of the same entity. If you have just one file in there, you just need to be consistent.
col_lists: List of tuples. One tuple per plot. Each tuple refer to columns needed for that plot. Depending on the number of columns, you’ll get a different plots (see Plots).
chunk_size: [optional] if you want to change the chunksize. By default it was optimised for speed and memory. You’ll probably want to change that if you use dl1_images (see Change parameters).
nevent_threshold: [optional] If you don’t want to read all events (see Change parameters).
custom_axis: [optional] if you want to overwrite histogram axis definition for default columns, or define your own axis definition for your custom column (see Overwrite axis definition for default column).
custom_cols: [optional] if you want to define new columns that are not defined by default in input files (see Benchmark with custom column).
Simplest benchmark#
Assuming you just provide pre-existing columns, your benchmark would look like this:
class MyBench(AutoBenchmark):

    data_level = "dl2"

    # For each histogram, define, in the right order, the column corresponding for each axis.
    col_lists = [
        ("type", "true_hillas_intensity", "HillasReconstructor_h_max"),
        ("true_impact_distance", "HillasReconstructor_h_max"),
        ("type", "true_impact_distance"),
        ("true_impact_distance",),
    ]
Each line in col_lists correspond to a plot. Depending on the number of column you will get a different plot (see Plots).
Change parameters#
class MyBench(AutoBenchmark):

    data_level = "dl1_images"
    chunk_size = 10000
    nevent_threshold = 40000

    col_lists = [
        ("true_impact_distance",),
    ]
Overwrite axis definition for default column#
class MyBench(AutoBenchmark):
    data_level = "dl2"

    custom_axis = {
        "true_impact_distance": axis.Regular(
            "bins"= 31,
            "name"= "true_impact_distance",
            "start"= 0.5,
            "stop"= 1000,
            "transform"="log"),
    }

    col_lists = [
        ("true_impact_distance",),
    ]
Benchmark with custom column#
If you want to do some computation on existing column rather than just use their values, you can define a custom accumulation function and use it like this:
def get_hillas_ratio(events):
    """
    Compute custom column Hillas_intensity_err (i.e hillas ratio).
    """
    return (events["hillas_intensity"] / events["true_hillas_intensity"]) - 1


class MyBench(AutoBenchmark):
    data_level = "dl2"

    custom_cols = {
        "Hillas_intensity_err": get_hillas_ratio,
    }

    custom_axis = {
        "Hillas_intensity_err": axis.Regular(
            bins=61,
            start=-1,
            stop=1,
            name="Hillas_intensity_err",
            overflow=True,
            underflow=True,
            label="(Reco-True)/True",
        ),
    }

    col_lists = [
        ("type", "true_hillas_intensity", "Hillas_intensity_err"),
        ("true_impact_distance", "Hillas_intensity_err"),
        ("type", "true_impact_distance"),
        ("Hillas_intensity_err",),
    ]
Plots#
1D histograms (1 or 2 columns)#
Plot definition in AutoBenchmark:
col_lists = [
        ("true_impact_distance",),
        ]

1d histogram#
col_lists = [
        ("true_impact_distance",),
        ]

1d histogram with comparison of 2 stores#
col_lists = [
        ("type", "true_impact_distance"),
        ]

1d histogram with comparison of 2 stores and categories#
col_lists = [
        ("type", "true_impact_distance"),
        ]

1d histogram with categories#
2D Histograms (2 or 3 columns)#
col_lists = [
        ("true_impact_distance", "Hillas_intensity_err"),
        ]
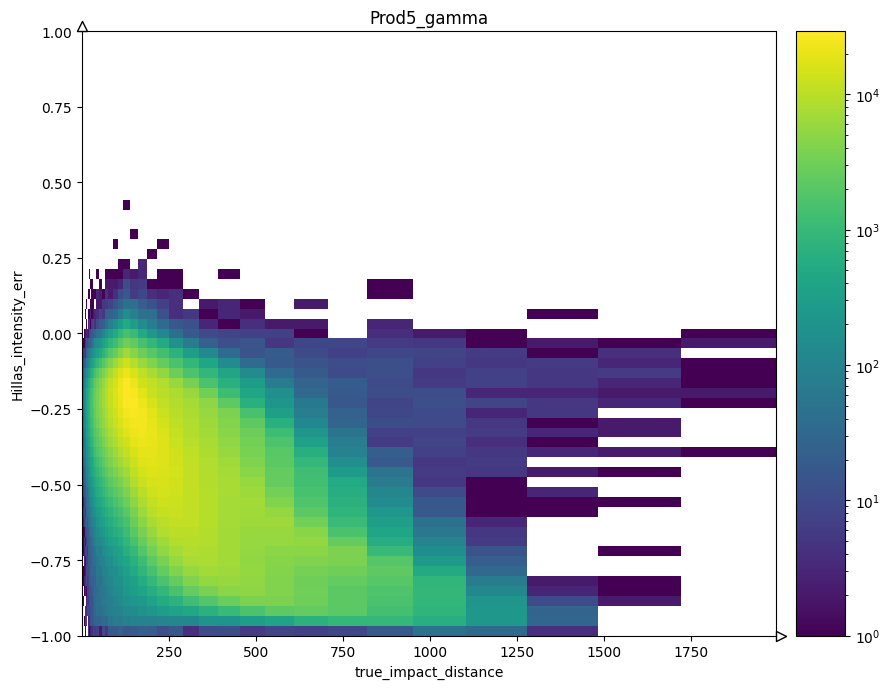
2d histogram#
col_lists = [
        ("true_impact_distance", "Hillas_intensity_err"),
        ]
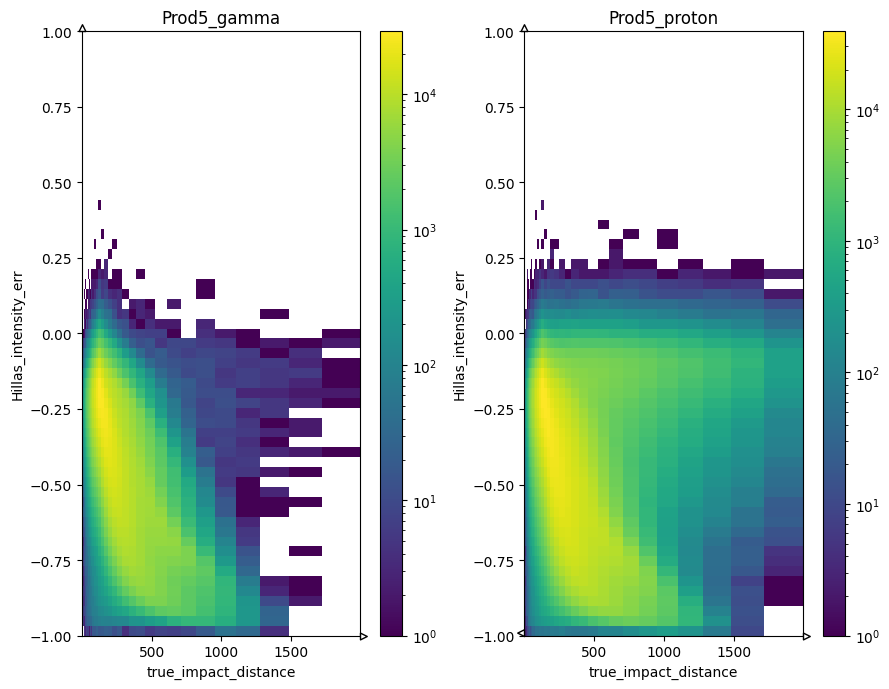
2d histogram with comparison of 2 stores#
col_lists = [
        ("type", "true_hillas_intensity", "Hillas_intensity_err"),
        ]

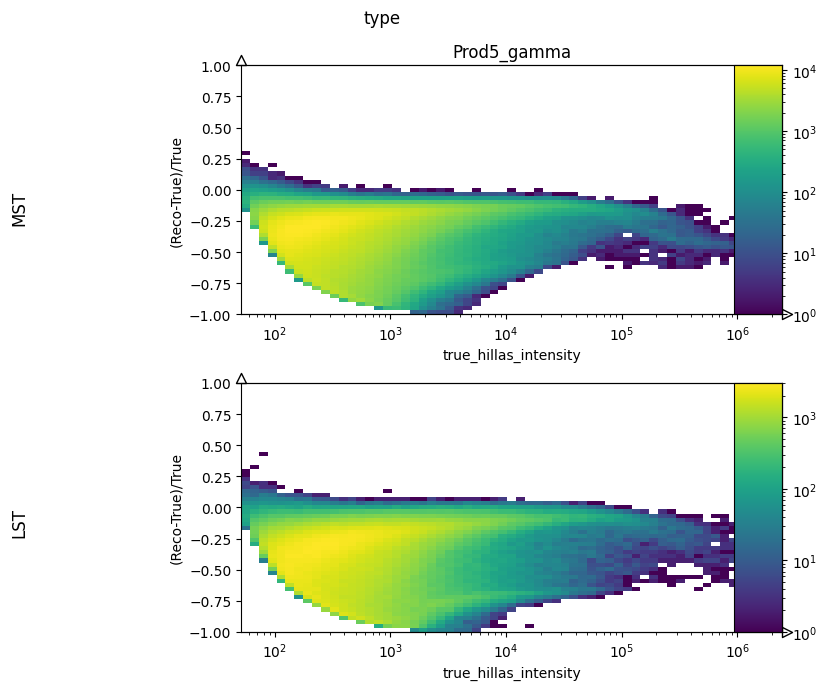
2d histogram with comparison of 2 stores and categories#
col_lists = [
        ("type", "true_hillas_intensity", "Hillas_intensity_err"),
        ]
2d histogram with categories#
Limitations#
If you want to use the same column, but with different accumulation on different plots, the only solution is to define a custom column with a different name and define a custom accumulation function.
In order for the system to be automatic, I need automatic and predictable names for intermediate products. This is because at the plot level, I don’t know anymore what columns where used and how many there is. I use the plot name to infer that.
Histogram can be 1D to 3D maximum. If 3D, the first dimension need to be a category axis. Only one category axis is allowed per histogram, and it needs to be first in the list of axis.